Did you know that dust and pollen accumulation can substantially reduce your solar panels’ efficiency, often without obvious signs? Many operators overlook how these particles gradually block sunlight, causing energy losses that might go unnoticed until production drops noticeably. Understanding how to accurately calculate this decline can help you maintain peak performance. Exploring methods to measure and respond to these losses can reveal why some systems perform better than others over time.
Key Takeaways
- Measure the decrease in energy output compared to a clean, baseline system after a known period of dust and pollen buildup.
- Record regular energy production data to identify trends and quantify losses over specific timeframes.
- Calculate the percentage loss by comparing current output to initial or expected performance levels.
- Factor in environmental conditions and seasonal pollen/dust levels to estimate their contribution to overall production decline.
- Use performance modeling or empirical data to determine the relationship between particle accumulation and efficiency reduction.
Understanding how to calculate solar production loss is essential for optimizing your solar energy system’s performance. Dust and pollen accumulation on your panels can considerably reduce efficiency, leading to efficiency degradation over time. By understanding how these factors impact your system, you can better plan cleaning routines and maintain ideal energy production. The key to minimizing production loss lies in accurately estimating how much dust and pollen settle on your panels and how often cleaning is necessary to keep efficiency high.
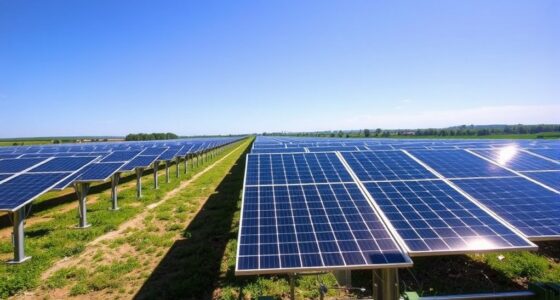
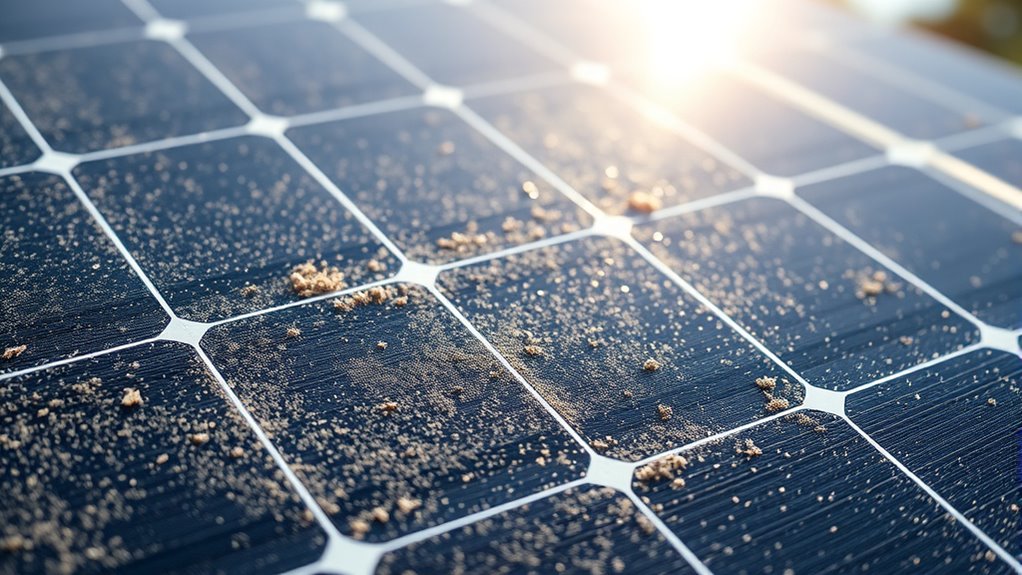
Dust and pollen act as barriers, preventing sunlight from reaching the solar cells. This buildup diminishes the amount of solar radiation your panels can absorb, directly lowering energy output. The rate at which this buildup occurs depends on your local environment—areas with high pollen seasons or dusty conditions will experience faster efficiency degradation. To accurately calculate production loss, you need to consider the typical dust and pollen load in your area, along with the frequency at which these particles settle on your panels. This is where understanding cleaning frequency becomes vital; more frequent cleaning can prevent substantial efficiency loss, but over-cleaning might waste resources and time.
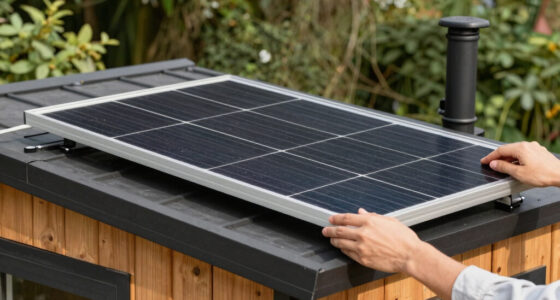
You can start by monitoring your system’s energy output during different seasons or weather conditions. A noticeable drop in production during pollen-heavy months indicates that dust and pollen are impacting your panels. Regular inspections can help you determine the best cleaning schedule. For instance, if you notice a 10-15% decrease in output after a month without cleaning, it’s a sign that more frequent maintenance might be needed. Conversely, if the loss is minimal, your current cleaning frequency could be sufficient. Additionally, keeping in mind that high-quality projectors can help visualize and analyze your system’s performance data more effectively, enabling more precise maintenance planning.
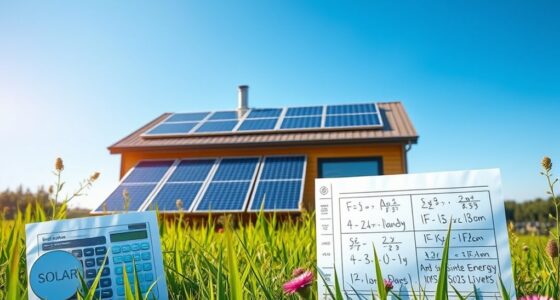
Calculating the exact amount of efficiency degradation over time involves measuring the decrease in energy production relative to your system’s expected output. You can record daily or weekly energy data and compare it to baseline measurements taken after thorough cleaning. This comparison helps you estimate how much dust and pollen accumulation contributes to production loss. Using these insights, you can set a cleaning schedule that balances maintenance costs with maximizing energy generation.
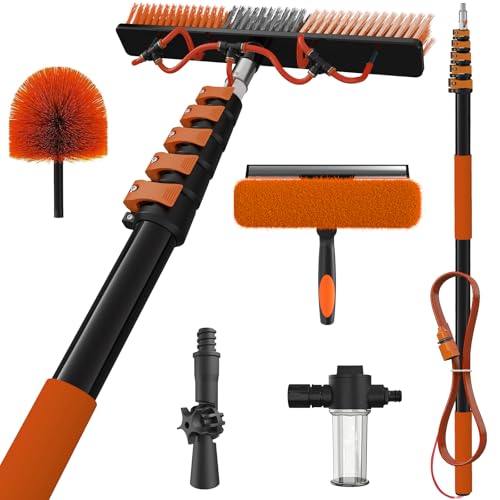
SKGPOLE 30Ft Reach Solar Panel Cleaning Brush Kit with 5-24ft Telescoping Pole, Water Fed Window Cleaner Tool with 20" Brush, Soap Dispenser, Cobweb Duster, Squeegee for Roof, RV, Gutter, Boat, Deck
- Wide 20" Cleaning Brush: Large coverage with high-density nylon bristles
- Adjustable Contour Fit: Brush adapts to panel contours for efficient cleaning
- High-Flow Water Nozzles: Four nozzles for extensive water coverage
As an affiliate, we earn on qualifying purchases.
As an affiliate, we earn on qualifying purchases.
Conclusion
By regularly monitoring your solar system, you can accurately track production losses caused by dust and pollen. Did you know that dust accumulation can reduce solar efficiency by up to 20%? Keeping an eye on these decreases allows you to optimize cleaning schedules and maximize energy output. Staying proactive not only boosts your system’s performance but also saves you money in the long run. Consistent maintenance guarantees you get the most from your solar investment.